May 14, 2023 By Team YoungWonks *
What is clustering?
Clustering is a way of machine learning that helps the computers learn about data. It means finding groups of similar things in the dataset. You don't need to know what categories things belong to first. The computer finds them on its own.
What is Spectral Clustering?
Algorithms are like formulas. They help computers remember past information, use it, and figure out what might happen next. Spectral Clustering is a special clustering algorithm that does this well. It usually works better than other algorithms for clustering.
Spectral Clustering is a popular unsupervised machine learning technique that is used in artificial intelligence for tasks such as image segmentation, community detection in social networks, and customer segmentation in e-commerce. It is widely used in machine learning and data mining. It utilizes graph theory and linear algebra to divide datasets into different clusters. It involves the following steps:
- An undirected graph G is created using either a similarity graph or an epsilon neighborhood graph.
- The Laplacian matrix of G is computed, and the eigenvectors corresponding to the smallest eigenvalues of L are obtained.
- These eigenvectors are then used to perform k-means clustering on the data points, with number of clusters k being a value set by the user.
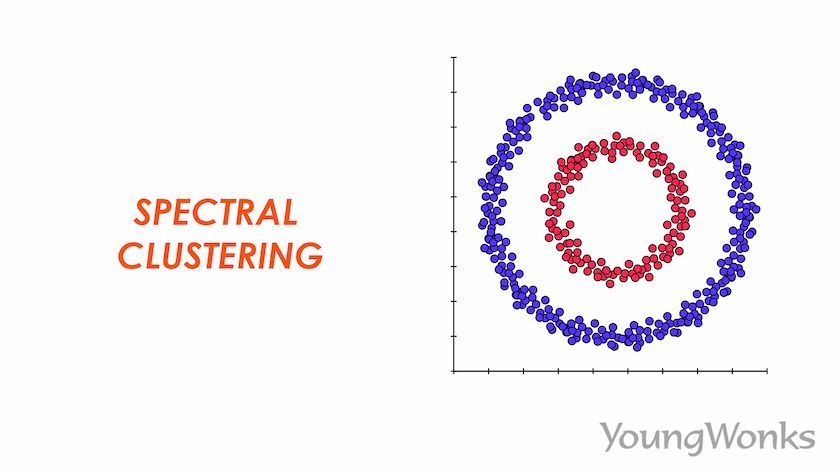
This technique can help with complicated (non-convex) structures and large datasets. It can work to separate the data into pieces that fit together, like puzzles. This is called convex clustering and it's used for things like image segmentation and other kinds of grouping.
The algorithm works by repeating steps over and over (known as iteration). It can use different ways to measure how many things are the same, like Euclidean distance or Gaussian similarity. Normalized cuts and random walks are two types of Laplacian matrix used to get a normalized Laplacian. Connectivity and the number of connected components can impact the quality of the clustering results, and hierarchical clustering can help make it better.
What are the advantages of Spectral Clustering?
The following are some of the advantages of Spectral Clustering:
- This algorithm is very simple and solves problems efficiently where only standard algorithms are needed.
- It takes the whole set of data and makes it fit in a smaller space. This way there is less data to look at.
- It is flexible and allows to cluster non-graph datasets as well.
- It is a popular machine learning algorithm that outperforms other approaches.
- This algorithm makes it easy to segregate data and form clusters.
- When data does not meet the requirements of other algorithms, there are still ways to find groups using this algorithm.
- It is a technique in data science to identify communities of nodes in a graph based on the edges connecting them.
What are the disadvantages of Spectral Clustering?
The following are some of the disadvantages of Spectral Clustering:
- In comparison to other clustering techniques like k-means clustering, Spectral Clustering has the drawback of being rather slow. If your dataset has a large number of data points, a faster algorithm will be better.
- K-means technique is used in a part of Spectral Clustering algorithms. Just like k-means clustering, Spectral Clustering depends on what numbers you choose and how you start it. If the process is done more than once, the results will be different.
- If you have a large dataset, think about using Spectral Clustering. It takes longer to use this method than other methods, so Spectral Clustering algorithms are even slower when there is more data.
- When looking at the affinity matrix, some of the eigenvalues may be the same. This is called multiplicity. It can be hard to pick the number of clusters, and it might make it difficult to tell which group something belongs to.
What are the applications of Spectral Clustering?
The following are some of the applications of Spectral Clustering:
- Image segmentation and object recognition
- Community detection in social networks
- Text clustering and document classification
- Gene Expression analysis and Bioinformatics
- Recommendation systems and customer segmentation in e-commerce
- Traffic analysis and anomaly detection in network data
- Video segmentation and activity recognition
- Shape and motion analysis in computer vision
- Spectral embedding for visualization of high-dimensional data.
These are just a few examples of the many applications of Spectral Clustering in different domains.
How do you perform Spectral Clustering?
A basic algorithm demonstrating the steps to perform Spectral Clustering is given below:
- Data Input
- Construct the similarity matrix
- Normalize the similarity matrix
- Compute the Laplacian matrix
- Perform eigenvalue decomposition
- Dimensionality reduction
- Clustering the data
Let’s understand the algorithm in detail.
Step 1: Data Input
Obtain the dataset containing the data points you want to cluster.
Step 2: Construct the similarity matrix
Calculate the pairwise similarity or affinity between data points using a chosen similarity measure, such as the Gaussian kernel, k-nearest neighbors, or cosine similarity. This step captures the relationships between data points based on their features or distances.
Step 3: Normalize the similarity matrix
Normalize the affinity matrix to ensure that each row sums up to 1. This step helps handle variations in data scales and ensures that each data point's influence on the clustering is proportional to its similarity with other points. To normalize, divide each element in the affinity matrix by the sum of its respective row.
Step 4: Compute the Laplacian matrix
Construct the Laplacian matrix from the normalized affinity matrix. The Laplacian matrix represents the graph Laplacian, which characterizes the connectivity and structure of the data. There are different types of Laplacian matrices, including unnormalized, normalized, and normalized symmetric. One common approach is to compute the unnormalized Laplacian matrix as the difference between the diagonal degree matrix and the affinity matrix. The degree matrix is a diagonal matrix where each diagonal element represents the sum of the corresponding row in the affinity matrix. Optionally, you can use a normalized Laplacian matrix that involves the inverse square root of the degree matrix.
In applications of Spectral Clustering, the Laplacian matrix is used to create a graph partitioning by computing the eigenvectors and eigenvalues, and then applying k-means clustering to the resulting lower-dimensional space to obtain k clusters.
Jordan's theorem states that the eigenvectors of the Laplacian matrix can be used to partition a graph into connected components. While Jordan canonical form is a mathematical concept used in Spectral Clustering to decompose the Laplacian matrix into a block diagonal form, which facilitates the identification of the number of clusters in the data.
In Spectral Clustering, the Laplacian matrix is derived from the adjacency matrix of the graph representing the data. A connected graph is required for Spectral Clustering to work properly, as disconnected graphs can result in spurious clusters. A connected graph is one in which there is a path between any two vertices in the graph. Here, Linear algebra plays a fundamental role in Spectral Clustering, as it involves the computation of eigenvectors and eigenvalues of matrices like the Laplacian.
Once the Laplacian matrix is obtained, the eigendecomposition is performed, and the resulting eigenvectors also called graph laplacian are used to transform the data into a lower-dimensional space. This lower-dimensional space represents the graph structure in a more concise form and allows for easier clustering.
Partitioning the graph into clusters is the next step in Spectral Clustering. This is typically done using a simple algorithm such as k-means clustering on the transformed data. The number of clusters is often determined by examining the eigenvalues of the Laplacian matrix, which represent the amount of variance captured by each eigenvector. Normalized Laplacian is a variation of the Laplacian matrix used in Spectral Clustering, where the degree matrix is replaced by a normalized degree matrix to better account for the size of the clusters. A random walk computes node similarity by measuring the probability of moving from one node to another, leading to the formation of a transition matrix that defines the Laplacian matrix.
The partitioning problem in Spectral Clustering involves finding the optimal way to group the data into clusters. This is a challenging problem that can be influenced by several factors, including the shape and size of the clusters and the choice of algorithm used for clustering. Additionally, the presence of outliers or noise in the data can make the partitioning problem more difficult.
Graph partitioning is a common application of Spectral Clustering, where the goal is to divide a graph into several smaller subgraphs or clusters. Spectral Clustering achieves this by representing the graph as a weighted adjacency matrix, computing the Laplacian matrix from the adjacency matrix, and then finding the eigenvectors of the Laplacian matrix.
Thus, Spectral Clustering transforms data into a lower-dimensional space using a graph-based approach and partitions it with k-means. Quality depends on graph connectedness and clustering algorithm. The partitioning problem involves finding optimal cluster grouping, influenced by various factors. Graph cuts are a technique used in Spectral Clustering to partition a graph into two disjoint sets by minimizing the cut, which is defined as the sum of the weights of the edges that connect the two sets.
Step 5: Perform eigenvalue decomposition
Compute the eigenvalues and eigenvectors of the Laplacian matrix. Eigenvalue decomposition helps uncover the underlying spectral structure of the data. Typically, compute a few eigenvectors corresponding to the smallest eigenvalues, as they capture the most informative low-frequency components of the data. Sort the eigenvectors based on the corresponding eigenvalues in ascending order.
Step 6: Dimensionality reduction
Select a specified number of eigenvectors corresponding to the smallest eigenvalues. Arrange these eigenvectors as columns in a matrix and normalize each row to have unit length. This matrix represents the reduced-dimensional representation of the data, where each row corresponds to a data point and the columns represent the reduced dimensions.
Step 7: Clustering the data
Clustering is the task of grouping a set of objects in such a way that objects in the same group are more similar to each other than to those in other groups. With respect to the concept of Spectral Clustering, clustering as a vital step in this approach is to cluster the reduced data using any established clustering method, commonly K-Means Clustering. First, a row of the normalized Graph Laplacian L Matrix is assigned to each node. Following that, this data is clustered using any conventional method. The node identifier is kept in order to alter the clustering outcome that has the characteristics of
- Higher accuracy
- Implementation for simplicity and speed
- Not scalable
We will discuss these characteristics one by one in the following sections.
Higher accuracy
This clustering method does not make any assumptions about the data's behavior, in contrast to other conventional methods. As a result, this technique can now be used to solve a wider range of clustering problems.
Implementation for simplicity and speed
Because it mostly consists of mathematical operations, this clustering approach is both more implementation-simple and faster than others.
Not scalable
It takes a long time to process dense datasets because it requires generating matrices and computing eigenvalues and eigenvectors.
Stressing the limitations of real world data
The restriction on the eigenvalue spectrum suggests that Spectral Clustering will only be effective on datasets with N clusters of roughly uniform size. The alignment of the complete space and sub-block eigenspectrums is not guaranteed otherwise. In general, the similarity graph and its characteristics can affect Spectral Clustering rather significantly. Additionally, the choice of similarity graph (such as the K-Nearest Neighbors graph or the e-neighborhood graph) might have an impact on the outcomes because each one reacts differently to data that is present in a range of densities and scales.
Additionally, utilizing unnormalized Spectral Clustering techniques can lead to consistency problems because it's likely that the data points won't converge to appropriate clusters as more data points are added. Poor similarity measures prevent Spectral Clustering from being applied since the A, which is used to produce the L, is crucial in determining similarity within data points. Sadly, there hasn't been a thorough investigation of how the similarity graph and its properties affect clustering. As a result, there are no valid generalizations.
Discover the World of Spectral Clustering with YoungWonks
Spectral clustering, a powerful technique in the realm of machine learning, can be a complex topic, but at YoungWonks, we break it down into understandable concepts for young learners. Our Coding Classes for Kids are designed to introduce the fundamentals in an interactive and engaging way. For those interested in diving deeper into programming, our Python Coding Classes for Kids provide the perfect foundation, leveraging Python's simplicity and versatility. Furthermore, our advanced AI Classes for Kids are tailored to demystify complex algorithms like spectral clustering, ensuring our students are not only knowledgeable but ahead of the curve.
Frequently asked questions related to Spectral Clustering
This section answers some frequently asked questions related to Spectral Clustering.
What is the difference between Spectral Clustering and Hierarchical Clustering?
Hierarchical clustering and Spectral Clustering are two distinct data clustering techniques, each with its own set of characteristics and advantages.
Hierarchical clustering organizes data into a hierarchical structure of nested clusters by merging or splitting clusters based on a similarity or distance measure. This technique can be divided into agglomerative and divisive clustering, resulting in a dendrogram that visually displays the hierarchy of clusters and aids in determining the optimal number of clusters.
In contrast, Spectral Clustering is a graph-based clustering method that transforms data into a lower-dimensional space using the eigenvectors of the Laplacian matrix. This technique is useful for complex or non-linear data that are not well-separated in the original high-dimensional space.
Hierarchical clustering is typically used for well-structured or well-separated data, while Spectral Clustering is well-suited for complex or non-linear data. Hierarchical clustering produces a dendrogram, while Spectral Clustering does not.
What is the difference between Spectral Clustering and K-Means Clustering?
Spectral Clustering and k-means clustering are both clustering methods, but they differ in their approach. K-means clustering assigns data points to the nearest centroid in a low-dimensional space, while Spectral Clustering first embeds the data points into a lower-dimensional space using the spectrum of an affinity matrix and then applies a clustering algorithm to the embedded data points.
Which is the most popular clustering algorithm?
The k-means algorithm has established itself as a popular and widely used technique in centroid-based clustering. Its efficiency in partitioning data into clusters based on the proximity of points to the centroids makes it a powerful tool for data analysis. However, like many other centroid-based approaches, k-means can be sensitive to outliers and the initial conditions used for clustering, leading to less optimal cluster assignments.
Despite these limitations, this course highlights k-means as a clustering algorithm of choice due to its simplicity, ease of implementation, and overall effectiveness in a variety of applications, ranging from image segmentation to customer segmentation in marketing. Through this course, learners can gain a deeper understanding of k-means and its various applications, including its ability to handle high-dimensional data and its use in combination with other clustering techniques to achieve superior performance in complex datasets.
What is Spectral Clustering in Machine Learning?
Spectral Clustering is a powerful machine-learning technique that can be used for a wide range of applications, from image processing and computer vision to bioinformatics and social network analysis.
*Contributors: Written by Alisha Ahmed; Edited by Rohit Budania; Lead image by Shivendra Singh