
Jun 17, 2022 By Team YoungWonks *
What is Pandas? What are its uses?
Pandas is an open-source Python library used in data science. This library is widely used throughout the data science industry. It is a fast and a very powerful python tool to perform data analysis. Pandas provides us with the commands to read, filter, inspect, manipulate, analyze and plot data. It loads data stored in various file formats such as csv, json, text, etc. as a pandas dataframe structure using a built-in function.
What is a pandas dataframe structure? How do we use this structure?
Pandas dataframe is a tabular structure. It is a two-dimensional data structure which consists data in the form of rows and columns. This library is used to group, aggregate, clean and filter data. It allows us to create subsets of the original dataset.
Basic Requirements
Ensure Python is installed on your computer. This tutorial demonstrates the usage of the library in a Jupyter notebook. So, you would have to ensure it is installed as well. You can refer to one of our earlier blogs to read about the steps required to install python and jupyter notebook using this link: https://www.youngwonks.com/blog/pydataset-a-python-dataset-library
Install and import the pandas package
In order to use the python pandas library, we need to first install it.
If you are using the windows operating system, open command prompt. If you are on a Mac, open the terminal to type in the below command.
Windows: pip install pandas
Mac: pip3 install pandas
If there are no errors, then the pandas library is successfully installed. Now that we have installed pandas, we need to import the library in order to use its functions.
Syntax: import pandas as pd
Load a dataset as a pandas dataframe
To work with a dataset, we need to load the dataset as a pandas dataframe.
Syntax: df = pd.read_csv(filename)
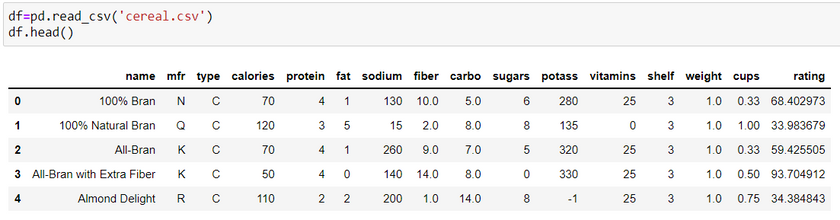
Here, we are using a sample dataset from kaggle. You can get the dataset using this link: https://www.kaggle.com/datasets/crawford/80-cereals
What is pandas dataframe filtering?
Filtering data is a preliminary step for any data science and machine learning application. It allows us to create subsets from the original dataset by forming smaller dataframes. This makes it easier to study, plot and analyze sections of the data. Therefore, it is important to know these commands in order to use them effectively. In this python tutorial, we are going to learn the top 10 ways to filter pandas dataframe.
Top 10 ways to filter pandas dataframe
1. Select particular columns using column values in a dataframe method
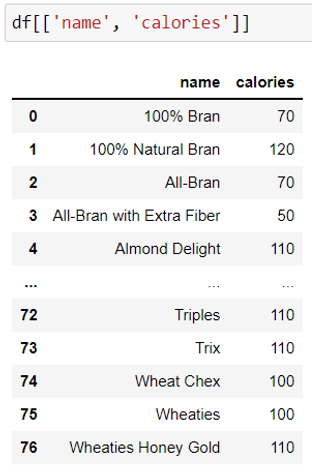
Making use of specific column names from the dataset, we can choose multiple columns from a pandas dataframe.
Syntax: df [ [‘‘column name 1', ‘'column name 2’’] ]
This dataframe method is used to choose only the columns which are required to build a specific machine learning model. This returns a new dataframe with all the rows from the given list of columns.
In the example given below, we get the name and calories columns from the cereals sample dataset.
2. Slicing using index to filter rows
Slicing is a method to get specific data from the original dataset using index or label. This is an indexing approach where we select rows, columns or specific rows and columns.
Syntax: df [start_index : end_index]
This returns specific rows with all its column values.
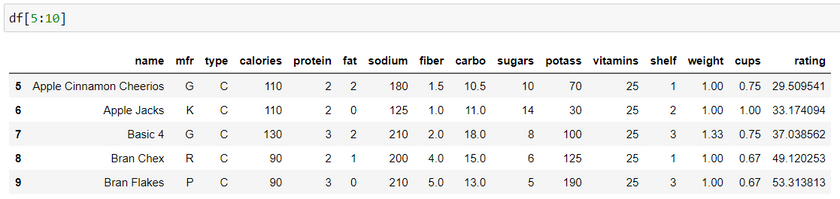
Here, the ending index is always 1 more than we need. Therefore, in the above example the output consists of data only till index 9.
3. Filter rows and columns using iloc() function
iloc() method selects rows and columns based on the index/position values.
Syntax: df.iloc [row index range, column index range]
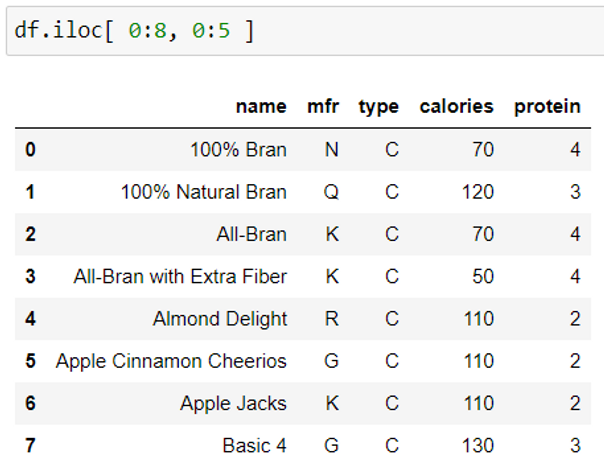
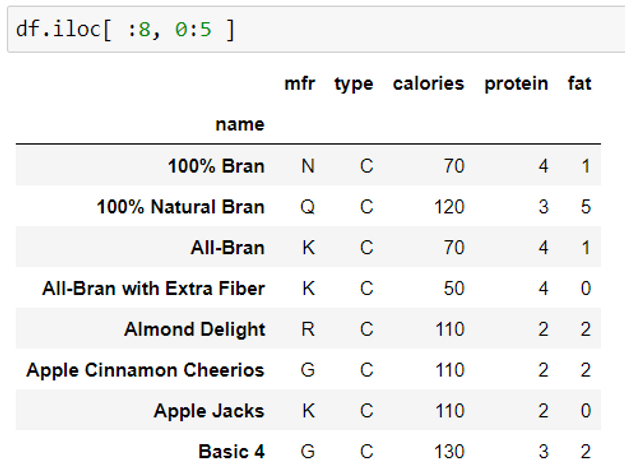
If you notice, both the examples above give the same output. This is because if we do not mention the start index or the end index, by default it takes 0 and -1 index value respectively. Therefore, the start row index in both the examples are 0.
4. Filter rows and columns using loc() method(slicing using labels)
dataframe.loc() method is a label based selection method. It is a way to select group of rows and columns using labels i.e., row values or column names. This returns a new dataframe from the original dataframe.
Syntax: df.loc [row dataset index/labels, ‘column_name’]
Here, row dataset index refers to the index column in the dataset. Index column values will be used to extract rows.
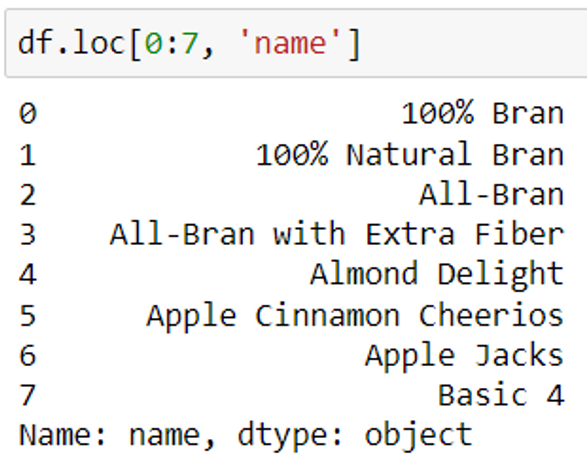
In this example, we are extracting only the names of the first 8 cereals(rows) using the loc() method.
Syntax: df.loc[['row value 1','row value 2'],['column name 1','column name 2']]
This returns specific rows and columns from the dataframe.
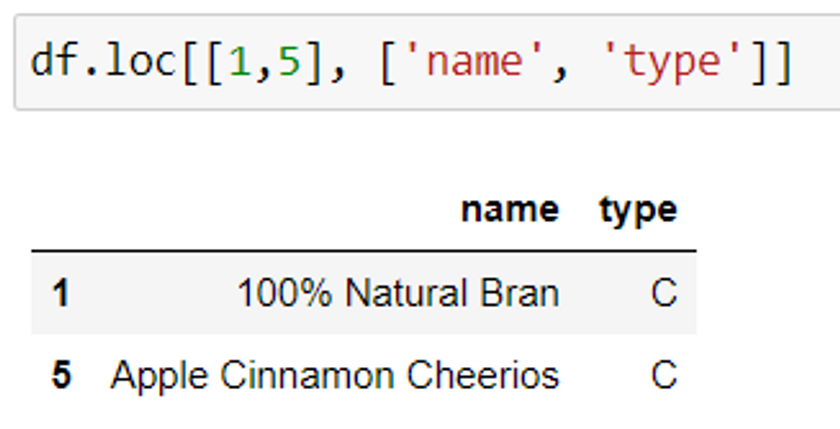
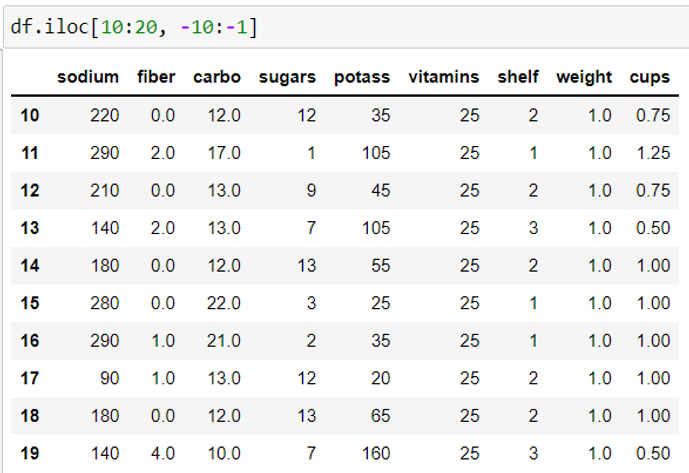
In the example given above, we have used negative index which counts column indices from the end.
Negative indexing is used to index values backwards. -1 is the first negative index value given to the last row or column.
Here, name and type of cereal for the 1st and 5th row is extracted. 1 and 5 are the row labels/index value.
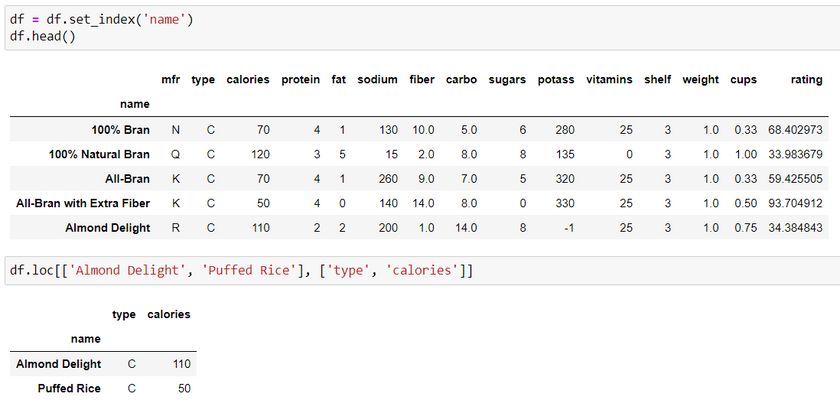
In the example given above, we reset the default index column to the name column of the cereals dataset. Then, we use the row index value to extract the type and calories.
5. Filter pandas dataframe using relational conditions
This method is often used to select rows based on particular column values.
Method 1: Using the dataframe method
Comparison operators is used to write these conditions.
a. Single condition:
Syntax: df [ (df[‘‘column name'] ==’column value’ )]
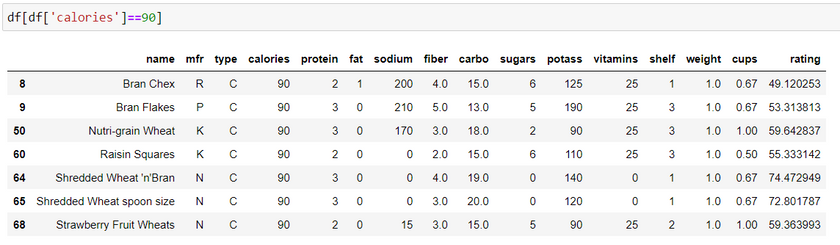
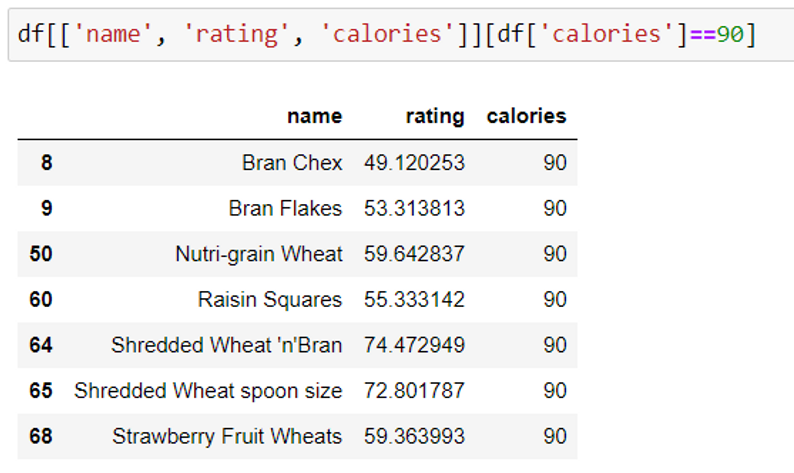
Both of the examples given below extracts data for cereals which have 90 calories. The first example displays all the columns and the second example displays only a few chosen columns.
b. Multiple conditions:
We use the ampersand (&) operator and the pipe (|) operator, for and and or logical operators respectively.
Syntax: df [ (df[‘‘column name 1' ]==’column value’ ) & (df[‘‘column name 2' ]==’column value’ )]
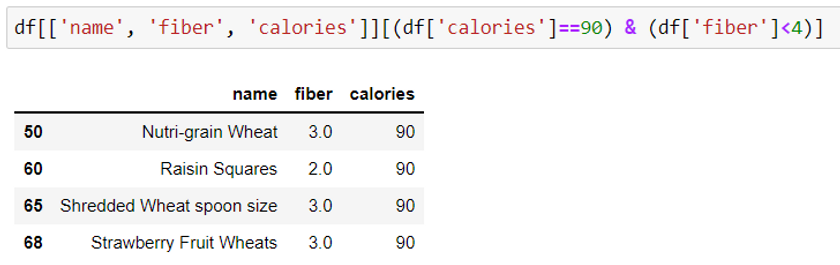
This example displays the name, rating and calories for the cereals whose calories are 90.
Method 2: Using loc() function
Filter the complete dataset based on the conditions:
Syntax: df.loc[(column name 1 >= column value) & (column name 2 >= column value)]

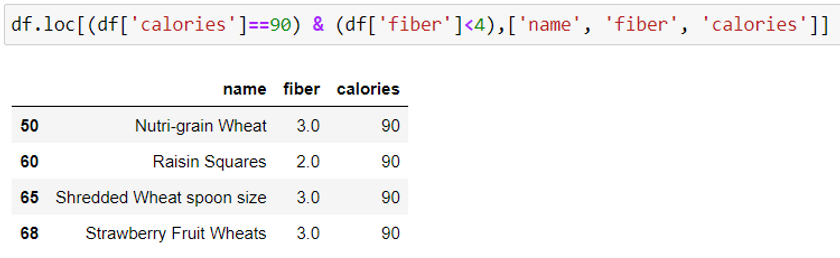
Select particular columns using conditions:
Syntax: df.loc [condition, [‘column_name 1’, column_name 2, column_name 3]]
To choose multiple columns, we pass the column names as a list in the loc() function.
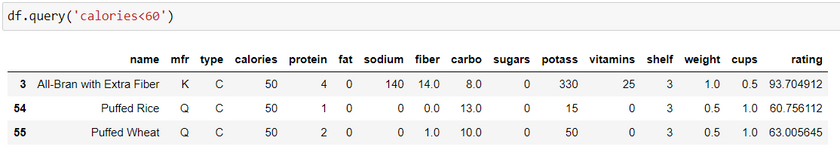
6. Using query function
The query function takes a query parameter in the form of a condition. It evaluates whether the condition is True or False. In simple words, it is used to query the columns using a boolean expression. This function can be used for both single or multiple conditions. It returns a new dataframe.
Syntax: df.query(column name >= column value )
The examples below show how to use the query function with single and multiple conditions.
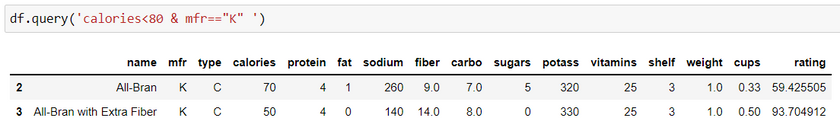
If we have to update the changes in the original dataframe, use inplace=True as an argument in the query function.
7. Filter single item from the dataset
Method 1: Using iat method
Syntax: df.iat[row index, column index]
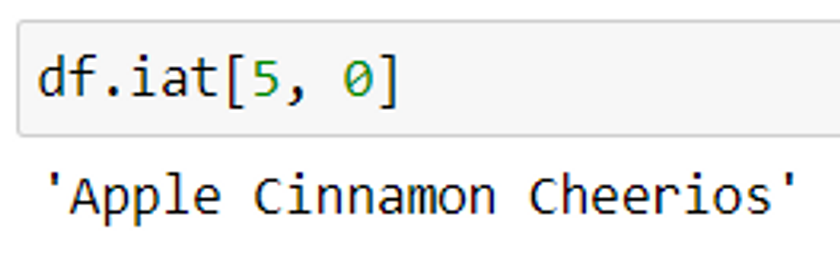
This method is using the row and column index. It is similar to the iloc() function but it works faster as it returns only a single value using a direct method.
Method 2: Using at method
Syntax: df.at[row index, column name]
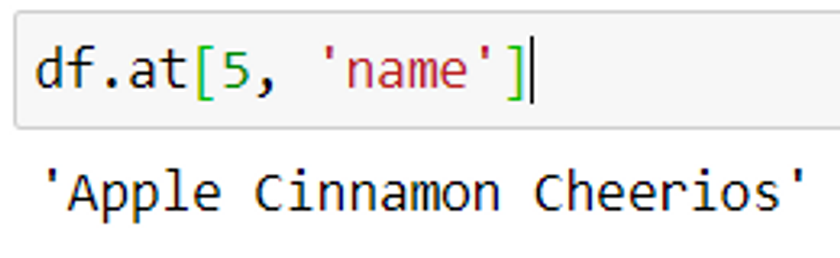
This method is similar to the loc() function.
8. Select dataframe rows based on a list membership
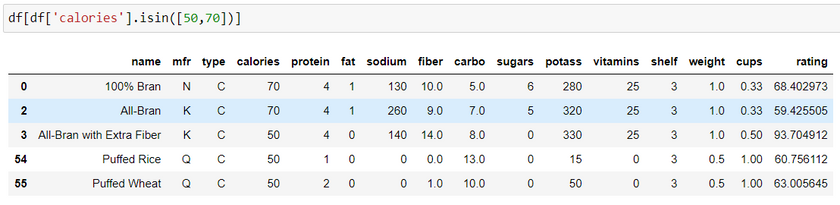
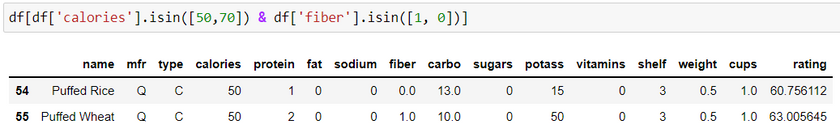
This method selects data using specific values in a column. It checks if the mentioned column has any of the values from the list of isin() function. It returns the rows which has the list values.
Method 1: Using dataframe method
Syntax: df [ df[column name].isin([column value 1, column value 2])]
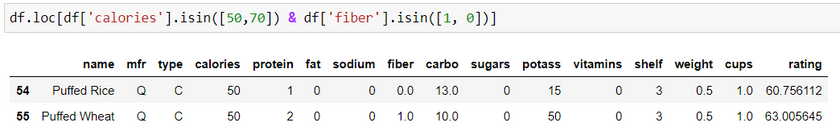
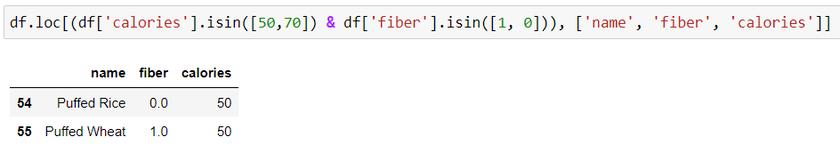
Method 2: Using loc() function
Syntax: df.loc [df[column name].isin([column value 1, column value 2])]
In the first example, it displays the complete dataframe i.e., all the columns. Second example displays only the selected columns.
9. Filter dataframe rows using regular expression (Regex)
Regular expression is also known as regex. This method is used when we work with text data. Regex helps us to match patterns to extract data from a pandas series or pandas dataframe. It checks if a string contains the required pattern.
Method 1: Using dataframe method
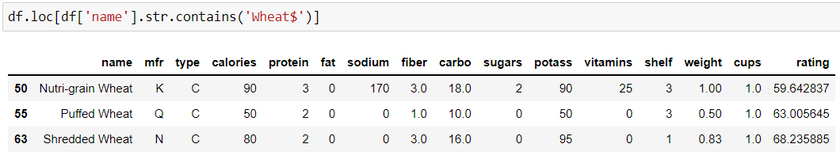
Syntax: df = df[ df[column name].str.contains('characters$')]
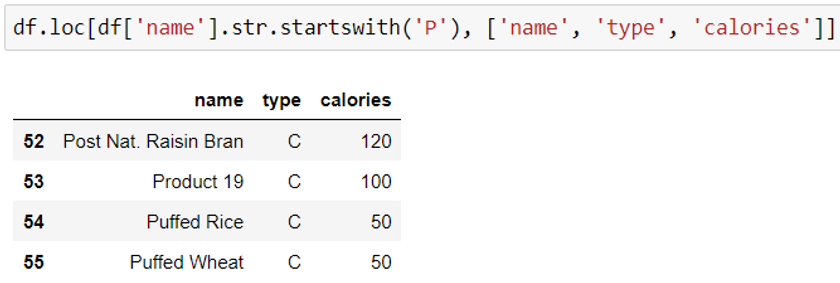
df = df[ df[column name].str.startswith('characters$')]
This expression will return a dataframe. It returns column values ending with characters specified in the str.contain() function. Similarly, str.startswith() function returns values which starts with a particular character.
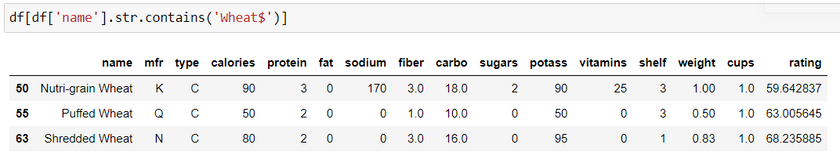
This example displays the rows where the name of cereals have the string Wheat. Adding ‘$’ sign at the end is the convention.
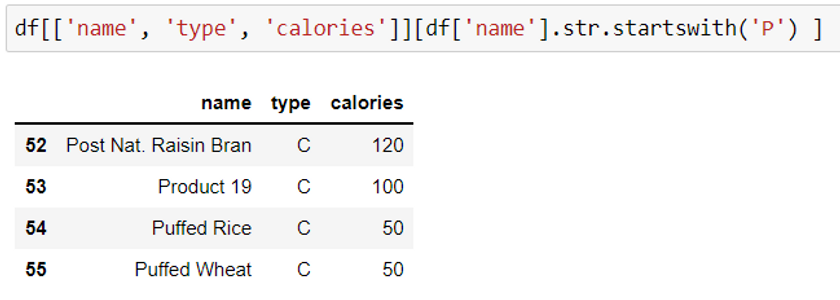
This example displays the rows where the name of cereals starts with the letter P.
Method 2: Using loc() function
Syntax: df = df.loc[ df.index.str.contains(‘characters$'), [column names] ]
Syntax: df = df.loc[ df.index.str.startswith(‘characters'), [column names] ]
All the examples given above gives the same output using different methods.
10. Filter data on the basis of not null or null/nan values
Null/NaN values are the missing values in a dataset. Any dataset can have missing value due to various reasons such as missing or incomplete data entry, lost files, etc. These values can create bias in the parameters used for data science applications or modeling. Therefore, it is necessary to first filter the missing values and then treat them. These two steps reduce the margin of error in predictions. Here, we will learn how to find missing values and missing value columns.
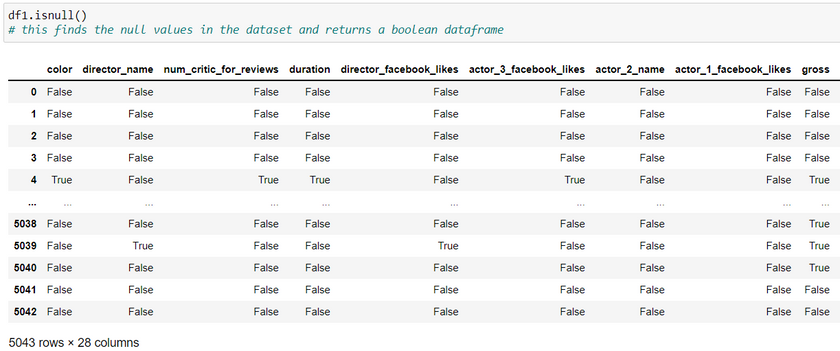
Step 1: To select data containing NaN/null values
We use isnull() and notnull() function.
Syntax: df.isnull()
This returns a dataframe having boolean values. It returns True if there is a NaN value else it returns False.
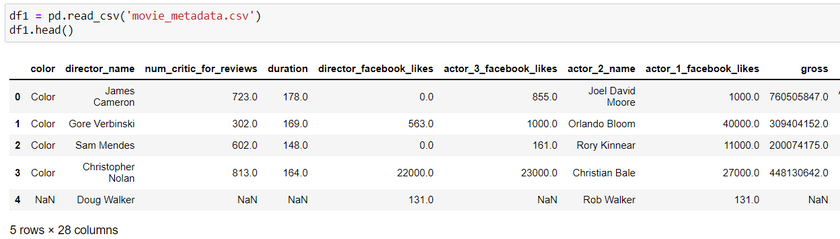
Here, we are using the movie metadata dataset. Use the link given below to download the dataset:
https://www.kaggle.com/datasets/karrrimba/movie-metadatacsv
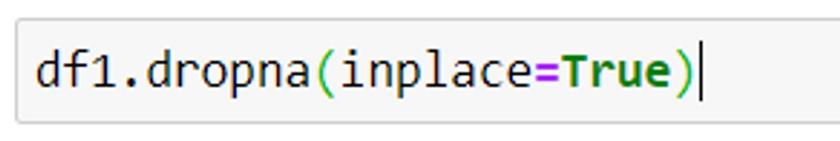
Step 2: Remove the null values
Syntax: df.dropna(inplace=True)
This function removes all the null values from the dataframe. include = True is used as an argument if we want to make changes in the original dataframe.
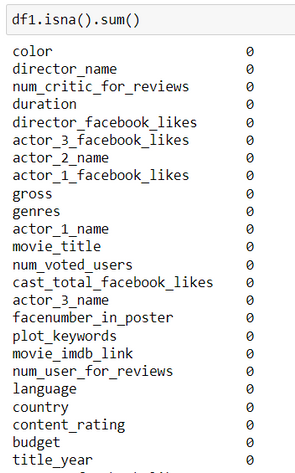
Step 3: Validate if null values are deleted
Syntax: df.isna().sum()
This function returns the sum of null values from each column of a dataframe.
You can use the link given below to view the Python source code for all the examples in a IPython Notebook:
Conclusion
Now that we have learnt the top 10 ways to filter pandas dataframe using the pandas library, you can now apply these to your own datasets. The next steps after filtering the data are to inspect, clean and analyze the data. You can refer to one of our earlier blogs to read about a few methods to inspect data using this link https://www.youngwonks.com/blog/pydataset-a-python-dataset-library. After data mining and cleaning, the next steps are to analyze the data using graphical plots. This helps us to understand the parameters and apply it to build the machine learning models. We often find that there are multiple methods to approach the same problem and the best method depends on the type of problem that we are looking to solve. At Youngwonks, our Coding Classes for Kids lay the groundwork in programming, our while our AI Classes for Kids provide the skills necessary to be able to understand the concepts and create innovative projetcs and applications.
*Contributors: Written by Aayushi Jayaswal; Lead image by Shivendra Singh