Aug 14, 2022 By Team YoungWonks *
Introduction
Regression is a type of supervised learning which is used to predict outcomes based on the available data. In this beginner-oriented tutorial, we are going to learn how to create an sklearn logistic regression model. We will make use of the sklearn (scikit-learn) library in Python. This library is used in data science since it has the necessary tools required for data analysis and to apply machine learning algorithms to our data.
To get deeper understanding about regression and linear regression , refer to our blog on Getting Started with sklearn Linear Regression. https://www.youngwonks.com/blog/Getting-started-with-sklearn-Linear-Regression
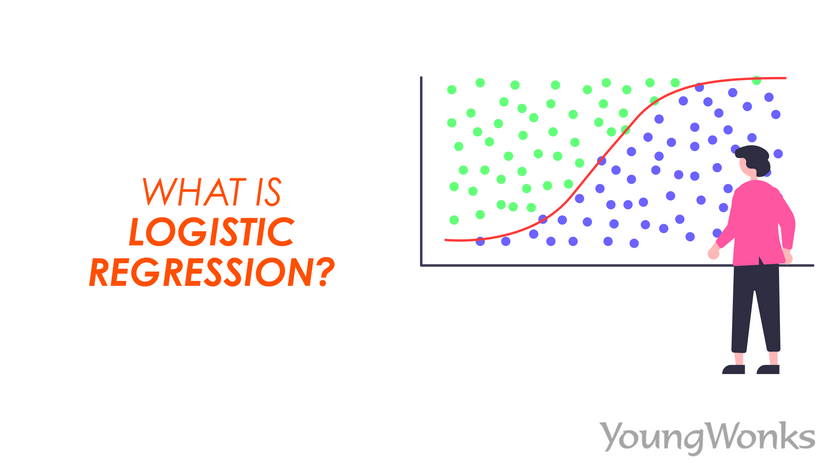
What is logistic regression?
- Logistic Regression is a machine learning algorithm that allows us to create a classification model. The algorithm analyses one/more independent variables and one dependent variable, to predict the output.
- This algorithm is used to predict categorical variables using independent variables which are continuous. It identifies which of the target classes, a given entity belongs to. Here, the target classes are the possible outcome of the dependent variables. For example if the dependent variable has only 2 possible outcomes then there are two target classes.
- Examples:
- Cancer Detection/Prediction: Regression could predict if a person is likely to suffer from cancer or not, given his/her past diagnostic information, considering similar known scenarios and their results.
- Sentiment Prediction: It can predict if a candidate can win the elections or not given the past historic data.
- Logistic Regression can classify entities into 2 or more classes based on the number of classes, the target values belong to.
- There are various types of logistic regression models:
- Binary classification: When there are only 2 possible outcomes, the classification is referred to as binary class classifier. This classification algorithm is best used for binary classification.
- Multi-class classification: If it has more than 2 classes, it's called multi-class classifier.
- The estimates the probability of an outcome and the value will be in between 0 or 1 (true or false). In binary class classification, for probability below 0.5 is considered as 0 (false) while more than 0.5 will be considered as 1 (true).
- The algorithm considers the natural log and the sigmoid functions to maintain the output values to be 0 or 1 only.
- Logistic Regression tries to fit the data to an S-shaped line,
p = 1/(1 + e-y ) ,
where e is the base of the natural logarithms e = 2.718… ,
You can also import math and then use math.exp
This is called a logistic/sigmoid function. This is also known as the logit or logistic function and is a multinomial expression.
p = 1/1+e-(b0 + m1x1 + m2x2 + m3x3 + … … mnxn)
The target classes (dependent variable) in logistic regression follows Bernoulli Distribution.
Bernoulli Distribution is a discrete probability distribution where only two outcomes are possible.
What is a sigmoid/logit function?
- A sigmoid/logistic function gives a S shaped curve. The function takes any real value and returns a value between 0 and 1.
- It is mainly used to predict probabilities, as it is always between 0 and 1.
f(x) = 1/1 + e-x
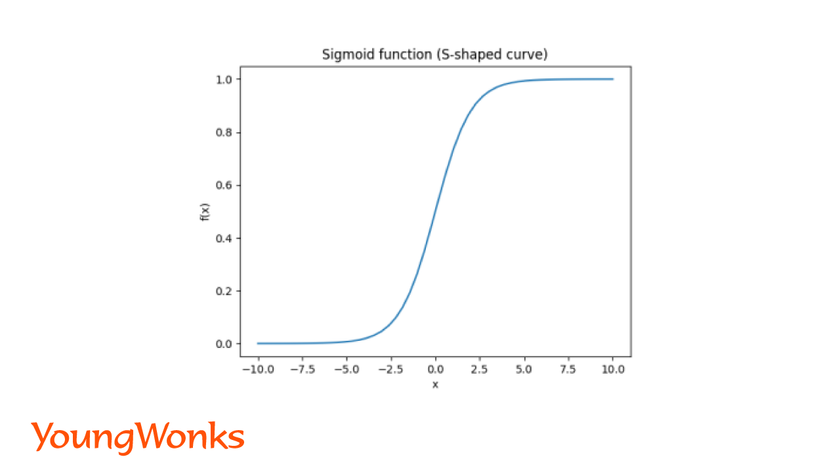
- The probability of a certain outcome, is considered to be a 0 or a 1 depending on the threshold. When the probability is > 0.5, it's considered to be a 'YES' or 1, and if it is < 0.5 it’s considered a 'NO' or 0.
- Example: After analyzing the data, if there is a 0.6 probability that a customer would buy a certain product, this case is classified as a 'YES'.
Logistic regression using sklearn (scikit-learn):
We will create models by applying logistic regression between two variables and use that to predict target classes (dependent variable). The following steps will help you do that.
1. Binary Classification Algorithm:
Let us look into the steps required use the Binary Classification Algorithm with Logistic regression.
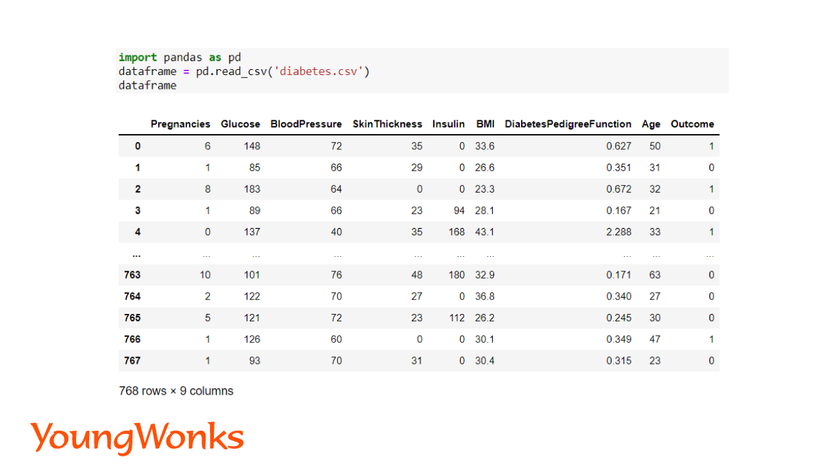
Step 1: LOAD THE DATA and IMPORT THE MODULES
The data has to be in the form of pandas dataframe using the pandas library.
Syntax:
import pandas as pd
dataframe = pd.read_csv(‘path-of-the-file‘)
In this blog, we will use the diabetes dataset to create a binary classification model.
Use the link given below to download the dataset:
https://www.kaggle.com/datasets/mathchi/diabetes-data-set
We will use the diabetes dataset to train our model and then predict whether a person is suffering from diabetes or not.
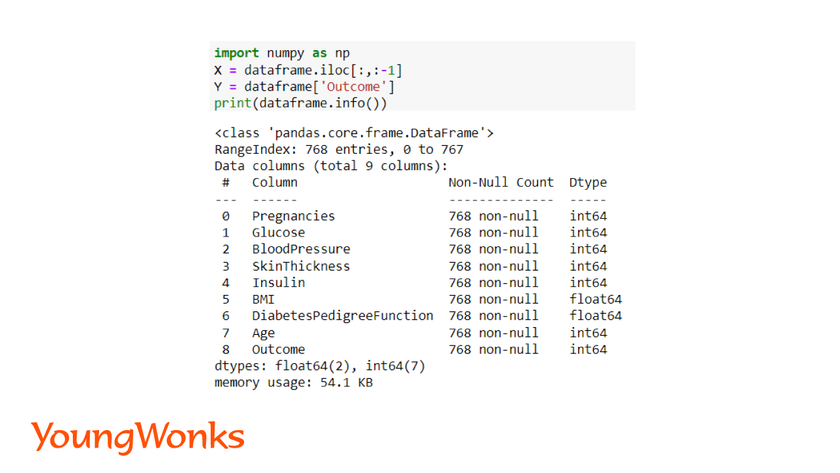
Step 2: PREPROCESS THE DATA
Data preprocessing is used to analyze, filter and manipulate the dataset.
Here, we have to make sure there are no missing values in the dataset.
The below function will help us to determine if there are missing values or not.
Syntax:
import numpy as np
dataframe.info()
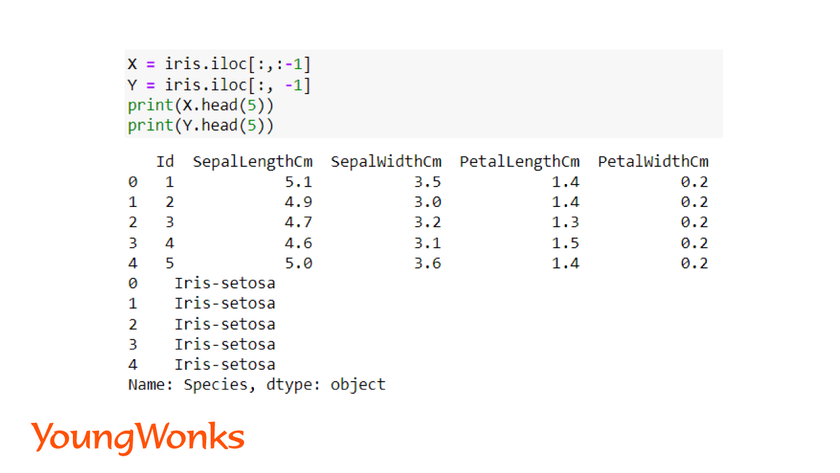
Define the independent and dependent variables.
Syntax:
X = dataframe.iloc[:,:-1]
Y = dataframe['Outcome']
We have to separate the dependent(X) and independent variables(Y) and store them into different variables.
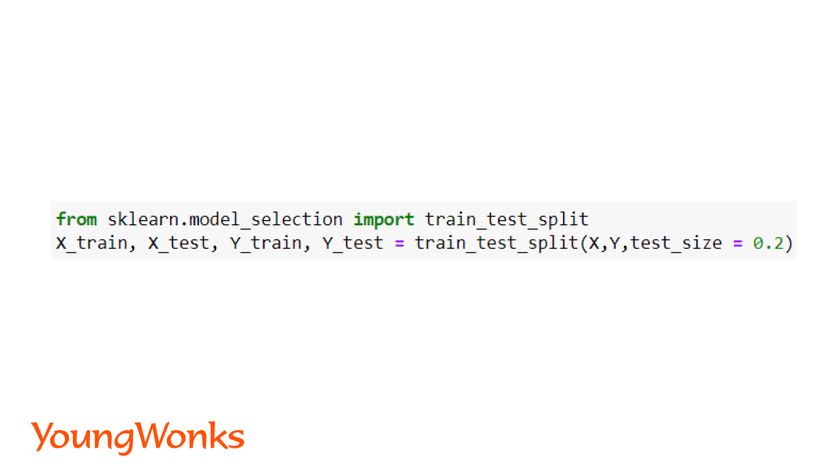
Step 3: TRAINING AND TEST DATA
We need to split the data to a training set and a test set.
- X_train - Values used to train the model where corresponding Y_train values are the actual results.
- X_test - Values used to validate the model later where Y_test values are the actual results.
from sklearn.model_selection import train_test_split
X_train, X_test, Y_train, Y_test = train_test_split(X, Y, test_size = 0.1)
- Random state: random_state is an argument which can be used when we split the data into train and test set. It acts as a seed value and can be assigned to any integer value. This argument is used to make sure various machine learning algorithms are fit and evaluated on the same subset of dataset.
X_train, X_test, Y_train, Y_test = train_test_split(X,Y, test_size = 0.1, random_state = 1)
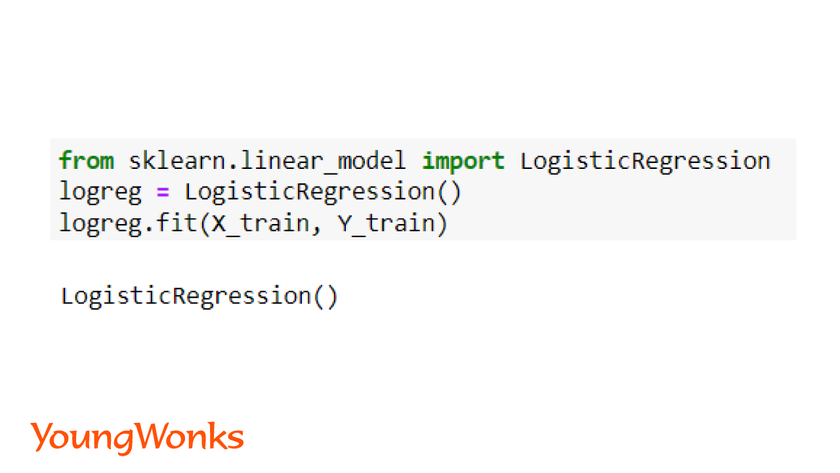
Step 4: CREATE THE MODEL AND FIT THE MODEL
Build the logistic regression model.
We train the model using the training data collected and, fit the model using the X and Y values. We can print the coefficient of the model as well.
Syntax:
from sklearn.linear_model import LogisticRegression
model = LogisticRegression()
model.fit(X_train, Y_train)
model.coef_
Step 5: PREDICTION
Use the model to predict the classes for new data.
Syntax:
y_pred = model.predict(X_test)
y_pred = model.predict_proba(X_test)
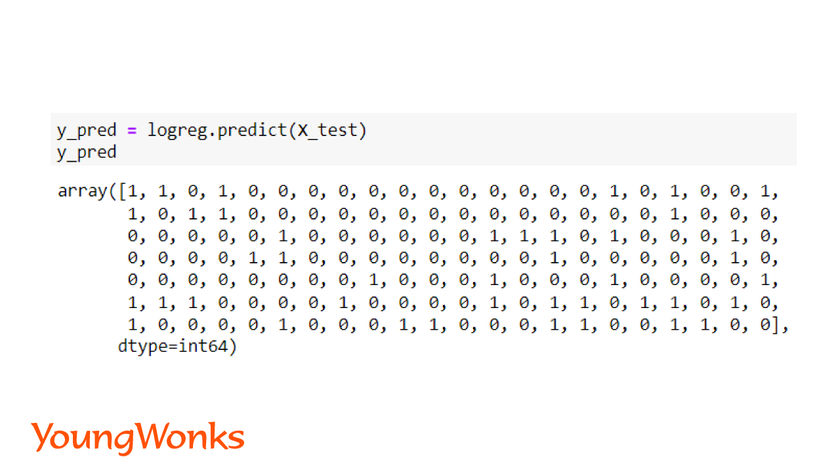
Both of the above method returns an array of predicted values. However, there is slight difference.
predict function gives an array of labels for the data points whereas predict_proba function gives an array of probability of each data point.
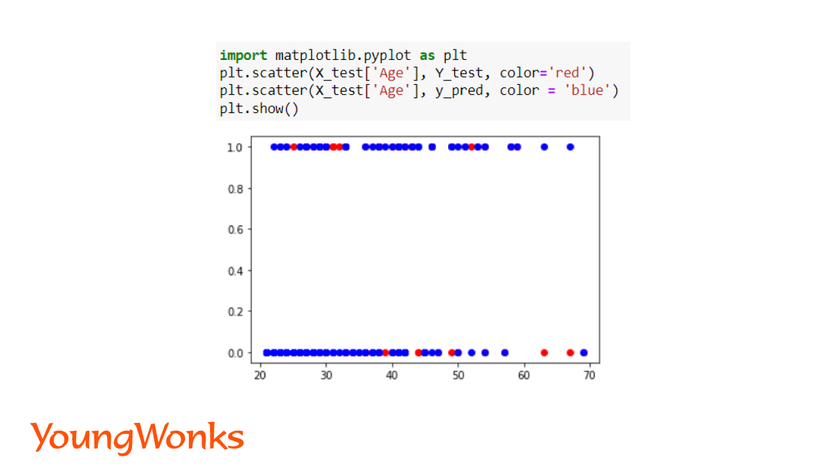
After we use the model to predict the values for the testing data, we can visualize the data.
Data Visualization: Plot a scatter plot to visualize the test data and the predicted data.
Syntax:
import matplotlib.pyplot as plt
plt.scatter(X_test['column_name'], Y_test, color='red')
plt.scatter(X_test['column_name'], y_pred, color = 'blue')
plt.title(‘Logistic Regression’)
plt.xlabel(‘x column‘)
plt.ylabel(‘y column‘)
plt.show()
To perform visualization of all the columns in the dataset, subplots can be generated.
In the diabetes dataset, we are plotting the test data for age and the predicted values.
Step 6: EVALUATE THE MODEL'S PERFORMANCE
Validate how accurately the model has predicted the category.
It validates for each entity from the testing data, by comparing it against the actual results known already.
Evaluation of the machine learning model is an important step since it allows us to understand how good and accurate the model is.
1. The Confusion Matrix
This is used for classification problems to predict how accurate the class labels are. It is the exact number of right and wrong predictions. The primary diagonal elements represent the number of correct predictions made. The non-diagonal elements are the wrong predictions made.
Metrics to be derived from the Confusion Matrix:
- True positive rate (Tpos) - How often does the model predict 'yes' when it is a 'yes'.
- False positive rate (Fpos) - How often does the model predict 'yes' when it was supposed to be a 'no'.
- True negative (Tneg) - How often does the model predict 'no' when it is a 'no'.
- False negative (Fneg) - How often does the model predict 'no' when it was supposed to be a 'yes'.
Syntax:
from sklearn import metrics
metrics.confusion_matrix(Y_test,y_pred)
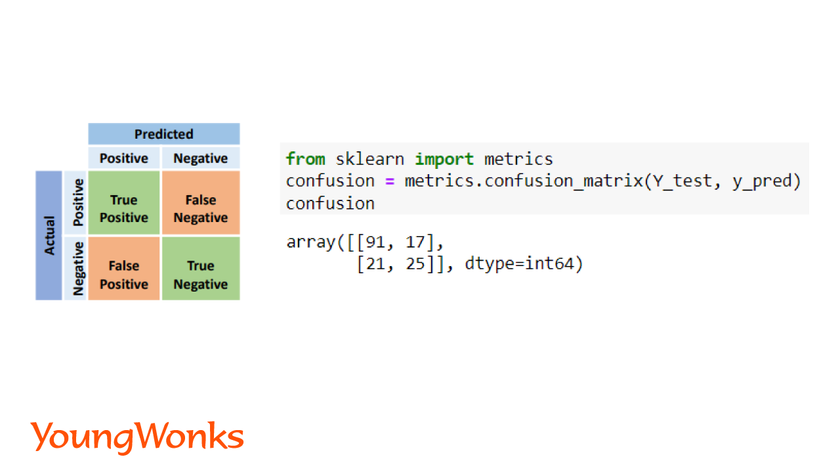
In this example, we see there are 91 true positive and 25 true negative. This shows that 91 patients are diabetic and 25 are not diabetic. This data show the correct results of the patients. However, 17 false positive indicate that 17 patients have been wrongly determined as diabetic and 17 false negative have wrongly not detected with diabetes. Therefore, it is very important to further improve the model in order to predict diabetic and non-diabetic patients correctly.
2. ROC Curve (Receiver Operating Characteristic Curve)
ROC Curve is usually used for binary classification algorithms. This curve plots the true positive against the false positive using a threshold value.
If the curve is above the model is considered to be a good model and curve below the model is considered to be a bad model.
Syntax:
from sklearn.metrics import roc_curve
Res = roc_curve(Y_test,y_pred)
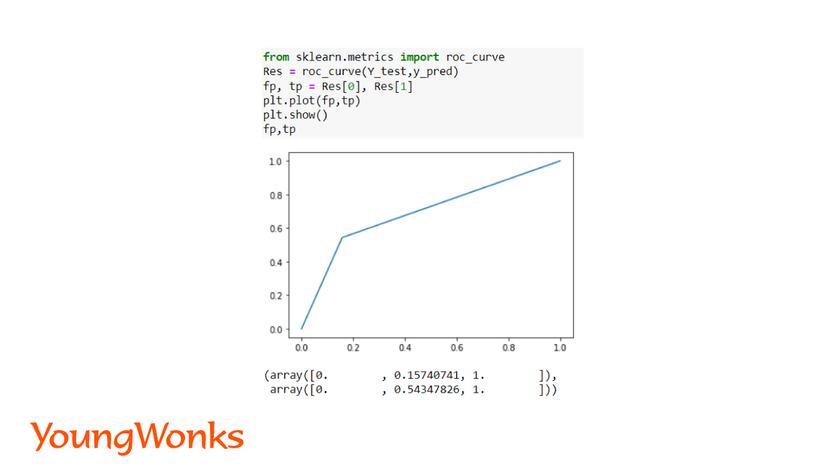
In the curve shown above, the threshold value is 0.15 and 0.54. The curve is above the diagonal which depicts it is a good model.
3. Accuracy Score
This is used to find out how often the model classifies it correctly. If the accuracy score is 1 it is considered to be a good model and 0 is considered to be a bad model.
correct_predictions = Tpos + Tneg
accuracy_score = correct_predictions/Total outcome
Syntax:
score = metrics.accuracy_score(Y_test, y_pred)
We can also determine the error rate which tell us how often the model can go wrong.
error_rate = 1 - accuracy
Multi-class Classification Algorithm:
Now that we have learnt the steps required to build the binary classification model. Let us look into the steps required to create a multi-class model.
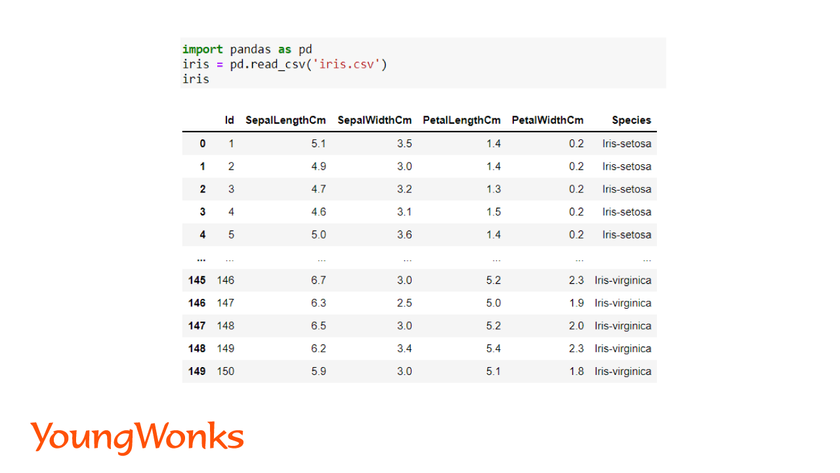
We will use the iris dataset for the creating a multi-class model. Use the link below to download the dataset: https://www.kaggle.com/datasets/arshid/iris-flower-dataset
Using this dataset, we use the sepal and petal length and width to classify the species flower.
We follow the same steps as binary classification model.
Step 1: Load and Preprocess Data
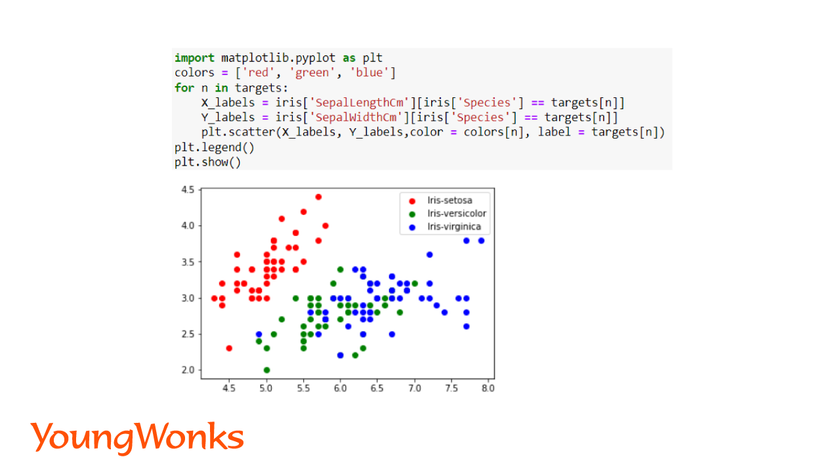
Here, we have created a dictionary having all the three target species class.
We have visualized the sepal length and width for the three species of the flower using the scatter plot.
Apart from using the pandas, matplotlib and numpy library, data scientists also use the seaborn library. This library provides advanced graphing technique which is useful in multiple linear regression. Using a single line of code, multiple graphs can be generated of each independent variable against dependent variable. It also ignores missing values during graph generation.
Syntax:
import seaborn as sns
Step 2: Training and testing Data
Step 3: Create, fit and predict
Create a model and fit the model. Predict the values for the test data. In order to visualize the data, plot a scatter plot for predicted and test data points.
Step 4:Evaluate the model
Using the iris dataset, we will use the accuracy score and confusion matrix to validate the model.
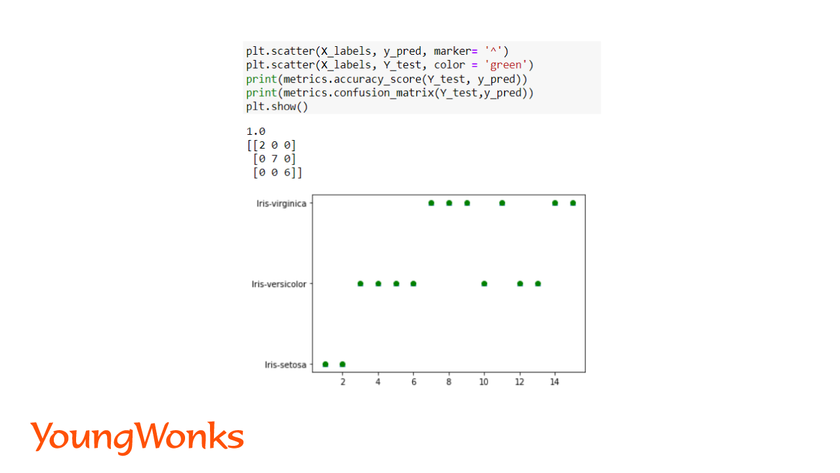
In the above example, the accuracy is 1 which shows the model is perfect, confusion matrix also depicts the same. It is successfully able to predict the species using the features of the flower.
The purpose of creating this model is to classify the iris flower species using its features. With diabetes model, we can predict faster if patient has diabetes or not using the past record and their profile. This will help in improving the health system and providing faster treatment to patients.
Conclusion
In this blog, we have covered the steps required to build a logistic regression model. This model is easy to create and the workflow remains the same. Now you can try this out with other datasets available on kaggle, datahub or earth data. You can try image classification, text classification using the same workflow. To take the models into next level with more accuracy you can use deep learning and neural networks.
Enhance Your Child's Learning with YoungWonks
At YoungWonks, we offer a wide range of Coding Classes for Kids that not only introduce them to the basics of coding but also to more advanced concepts such as machine learning and AI. Our Python Coding Classes for Kids provide a solid foundation in one of the most popular programming languages in the world, which is crucial for understanding concepts like sklearn logistic regression. For those eager to venture further into the realms of technology, our AI Classes for Kids are designed to equip young learners with the skills they need to excel in machine learning and AI, setting them on a path to becoming future innovators in technology.
*Contributors: Written by Aayushi Jayaswal; Lead image by Shivendra Singh