Jul 30, 2022 By Team YoungWonks *
What is regression?
A regression is a statistical method used to study and establish the relationship between a dependent variable and one or more independent variables. This algorithm is used to relate a dependent variable with one or more independent variables.
A dependent variable, also known as target variable, is the one we try to analyze whereas independent variables are the factors which influence the dependent variable. It is used for various purposes such as weather prediction, study of materials, study of certain diseases in healthcare and stock price prediction. This process helps us understand which factors are important, the changes in the dependent variable and the factors which are affecting each other.
Regression analysis is a machine learning algorithm used to predict continuous outcomes/values since it is applied on continuous data. It is a type of supervised learning used to plot a best fit line or curve between the data. This is a measure of the relation between the values of one variable (e.g., output) and the corresponding values of other variables (e.g., time and cost).
There are various types of regressions used to create machine learning models such as linear regression, logistic regression, ridge regression and lasso regression. In this beginner-oriented tutorial, we are going to learn how to create an sklearn linear regression model. We will make use of the sklearn (scikit-learn) library in Python. Scikit-learn library is built on numpy, scipy and matplotlib for data science. Data scientists prefer using this robust library since it provides algorithms which can be directly applied on a dataset to solve a real-life problem. This model will also be used to predict values which are outside the dataset.
Linear Regression using sklearn
Linear regression is used to predict a target variable value based on a given independent variable. The linear regression attempts to fit the data into the form,
y = mo xo + m1 x1 + ……………… + mn xn
where,
y is a dependent variable/target variable
xo, x1, …. ,xn are independent variables.
x is also known as the predictor variable or regressor since our prediction is based on these factors.
It is a linear model that assumes a linear relationship between the independent variables (x) and a dependent variable (y). In this, we find a straight line that best fits the scattered data points or the given values.
There are two types of linear regression:
- Simple Linear Regression: When there is only a single independent input variable, it is called Simple Linear Regression. Example: House prices based on only the area.
- Multiple Linear Regression: When there are multiple independent input variables, it is called Multiple Linear Regression. Example: House prices based on the area, number of rooms and distance to employment centers.
Install sklearn
pip install sklearn
Simple Linear Regression
In this we look to establish a linear relationship utilizing the given data which fits an expression
y = mx+c
Here, c is the intercept and m is the slope of the line. We consider only 1 dependent value and establish the correlation between 2 variables only.
Linear Regression gives us the most optimal value for the intercept and the slope. Using this, the y value can be predicted for any x value. This is also referred as univariate/simple linear regression because there is only a single independent variable. A best fit line minimizes the divergence between related data points. This is also called as loss where we try to minimize the overall loss.
Steps to create simple linear regression model using sklearn
We will create a model to predict the value of the dependent variable(y) given any value of independent variable(x).
Step 1: Load the Dataset
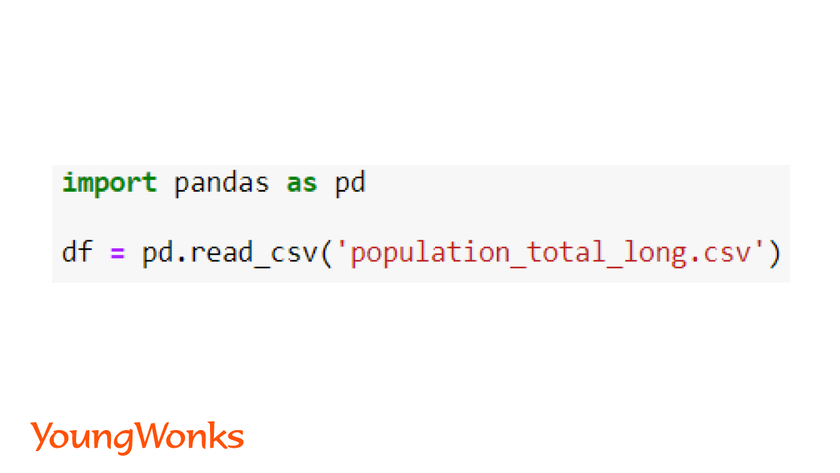
Data can be loaded from csv or text files as a dataframe using the pandas library.
Syntax:
import pandas as pd
dataframe = pd.read_csv('path to the file')
In this blog, we will use the population dataset which has the population of each country in the world over the years.
Use the link given below to download the world population dataset:
https://www.kaggle.com/datasets/imdevskp/world-population-19602018?select=population_total_long.csv
We will use this dataset to train our model and then predict the population in the future.
Step 2: Preprocess the Data
Data is filtered, cleaned, manipulated and analyzed in this step.
We will pre-process our dataset to consider the entire world's population. To do that, we have to add the population of every country for each year in the dataset. We will use the pandas groupby function to group by each year and then the sum function to add the count in the database.
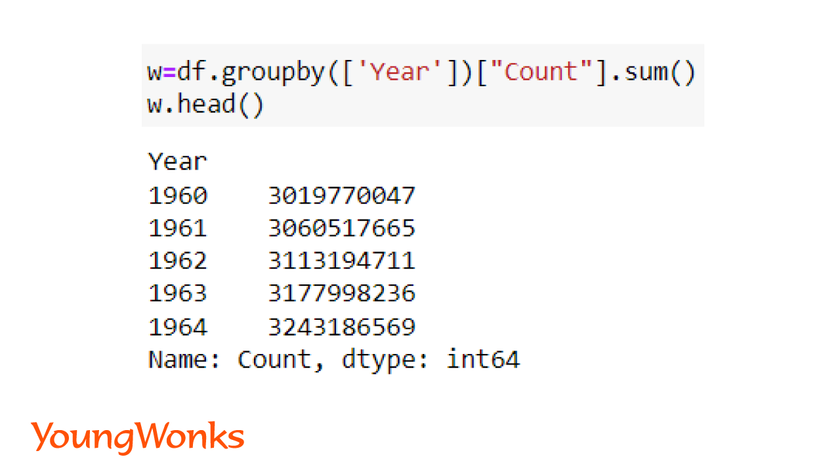
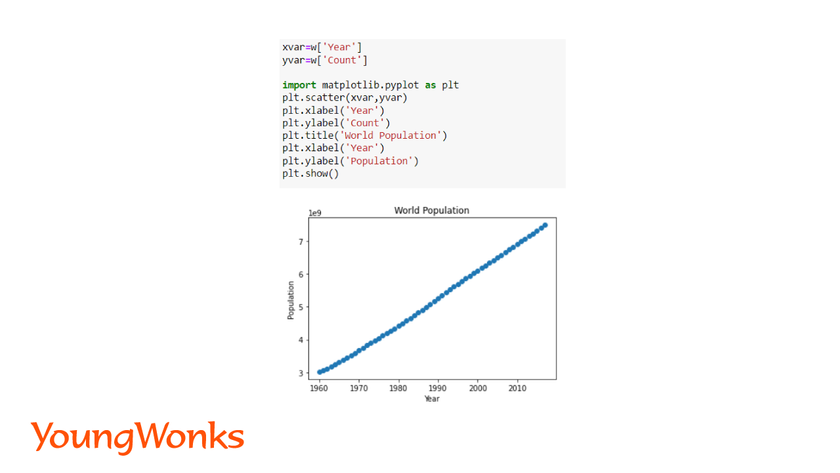
Here, the years will be considered for the x value (independent variable). Count/Population will be taken as the y value (dependent variable). For visualization of data, we can plot the values on a scatter plot using Matplotlib.
Syntax:
import matplotlib.pyplot as plt
plt.scatter(x, y)
plt.show()
In this blog the dataset which we have used as an example doesn’t require much preprocessing. However, in real life, cleaning and filtering of collected data is one of the most important preliminary steps performed prior to modeling. Data scientists invest ample amount of time on cleaning huge amount of data.
You can refer to our blogs on "pydataset-Python dataset library" and "10 ways to filter pandas dataframe" to learn the basics of data representation and filtering. Below are the links to these blogs:
https://www.youngwonks.com/blog/pydataset-a-python-dataset-library
https://www.youngwonks.com/blog/top-10-ways-to-filter-pandas-dataframe
Step 3: Create the Linear Regression Model and Fit the Model
A model is defined and then trained with the train set.
We fit the model with the x and y values.
Syntax:
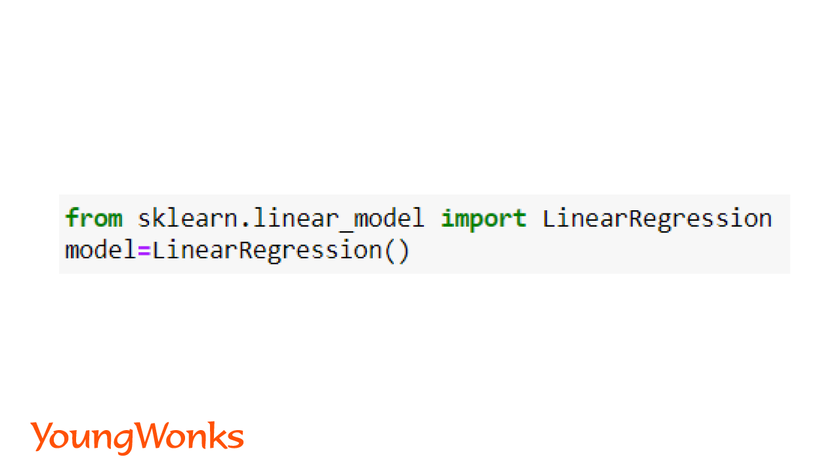
from sklearn.linear_model import LinearRegression
model = LinearRegression()
model.fit(x, y)
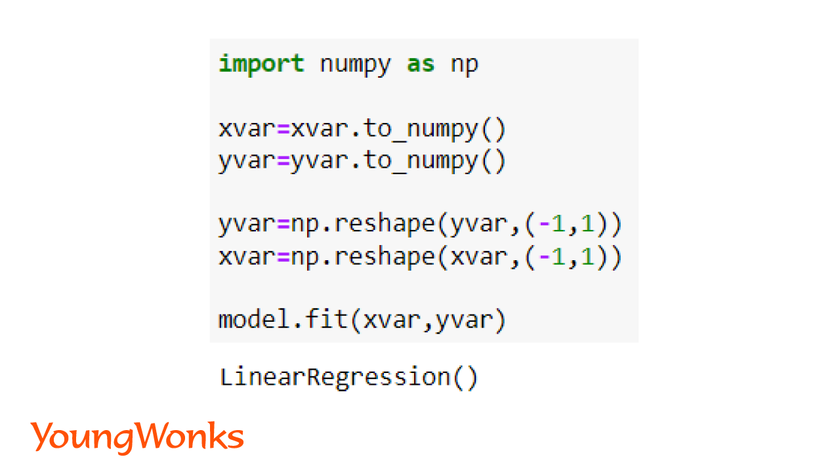
In the world population dataset, we can observe that x and y are 1-D arrays. We need to convert the x values into a 2-D array to be able to fit the model. In order to convert it into a 2-D array,
- First convert the dataframe to a numpy array using the to_numpy() function.
- Then reshape it to get each value in x as an array by itself.
Syntax:
import numpy as np
x = x.to_numpy()
y = y.to_numpy()
x = np.reshape(X,(-1,1))
y = y.reshape(Y,(-1,1))
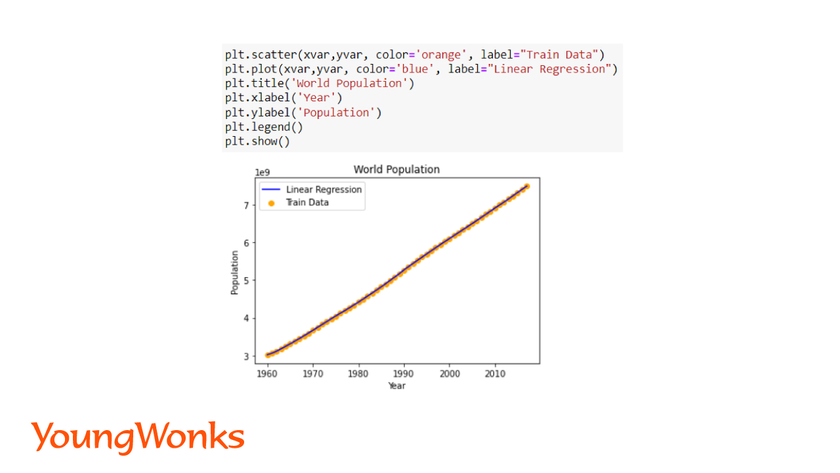
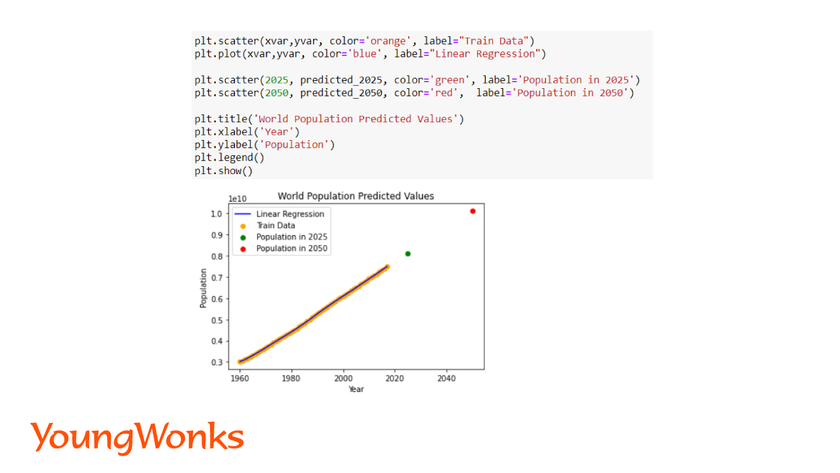
To see the best fit line, we will plot a line over the actual data points.
Step 4: Prediction
The model is used to predict values for new data.
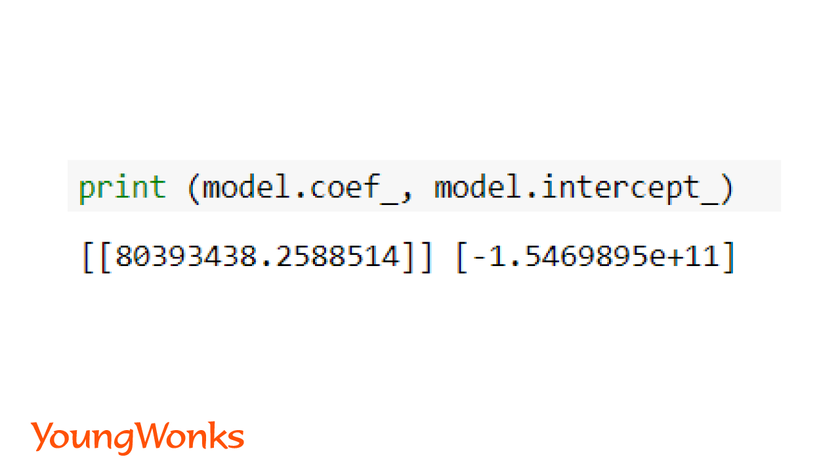
We have to plot the predicted values over the known values to show a Linear regression line on the plot. You can also print the actual values and the predicted values to observe the difference. We will print the model’s coefficient and intercept.
Syntax:
ypredict = model.predict(X)
model.coef_, model.intercept_
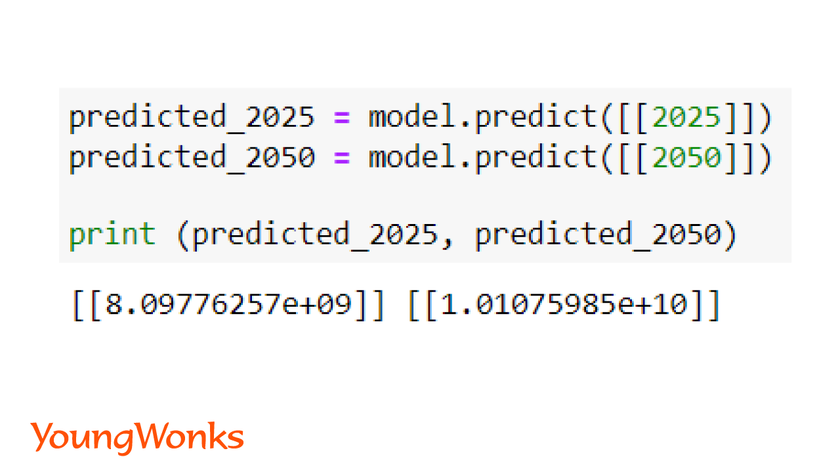
Now that we have trained the model, we can put it to use.
In this case we will use it to predict the world population trend over the next few years. We have predicted the world’s population for the years 2025 and 2050. We will also observe the predicted value graphically.
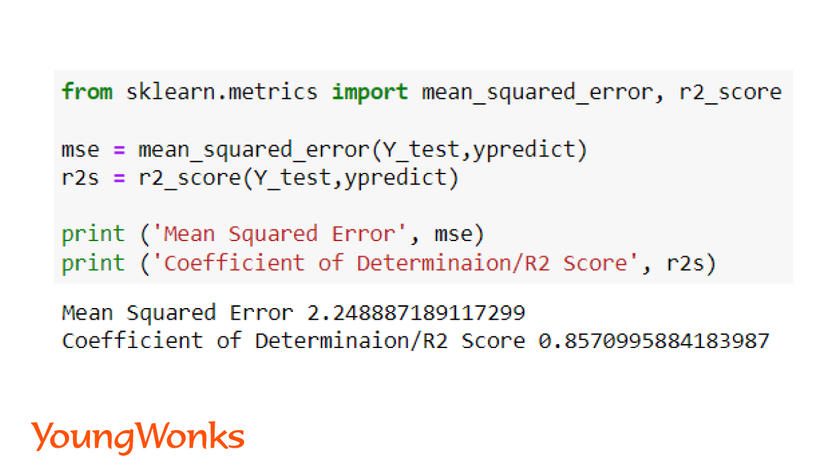
Step 5: Evaluate the Model's Performance
The performance of the model is checked by comparing the actual values with the predicted values. We use a few metrics to evaluate the performance of the model.
Syntax:
from sklearn.metrics import mean_squared_error, r2_score
In Regression we have the following metrics,
1. Mean Squared Error (MSE): It is the mean of the squared errors which is a popular metric.
The closer the value to 0.0, the better is the efficiency of the model. It shows how close is the linear regression line with the data points.
Syntax:
mse = mean_squared_error(Y, ypredict)
2. R2 score: This score refers to the coefficient of determination. This score shows how well the unknown data will be predicted by our model. The best possible score is 1.0.
Syntax:
r2s = r2_score(Y, ypredict)
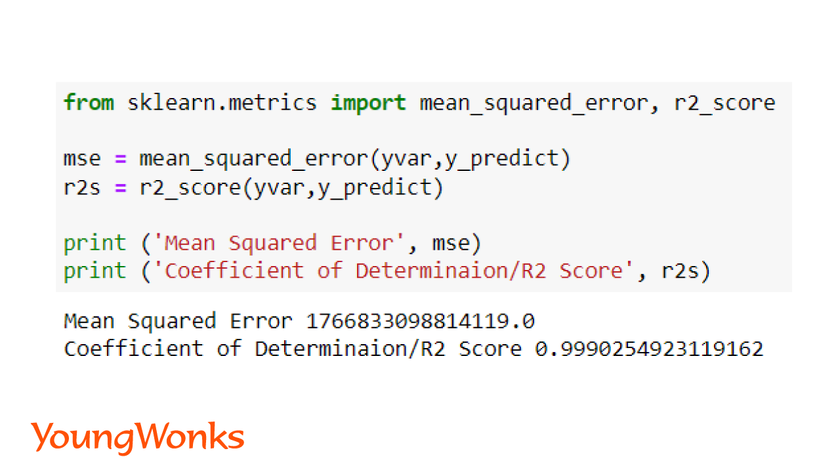
In order to get a better model, we need to reduce the error. The absolute value doesn’t imply if a model is good or not good. Lower the MSE, better is the model. We can train the model longer to reduce the error. In this example, the efficiency is found to be very low, therefore we have used the second metric to determine efficiency of the model.
There are a few other metrics such as root mean squared error (rmse), median absolute error and explained variance score which can be used for evaluating the performance.
In real life, any variable of interest will not be dependent on only one factor. Hence, simple linear regression is only used to understand the process of simple data pre-processing and modeling.
In order to create efficient machine learning model for real life data, we have to apply multiple linear regression which incorporates multiple factors.
Multiple/Multivariate linear regression
Most of the times only 1 parameter is not enough to predict the final output. Let us understand this using an example where we have to determine the price of a house. It will not only be the floor area of the house which will be considered, the price will also be dependent on various other factors such as number of rooms and bathrooms, furnished or non-furnished, luxuries of the house, etc. Here, we observe how there can be a greater number of factors which will impact the value of the house price. We use Multivariate Linear regression to predict these types of data.
We can represent this using the below equation:
y = b0 + m1x1 + m2x2 + m3x3 + … … mnxn
Here m1, m2, m3 ... are the coefficients for the model.
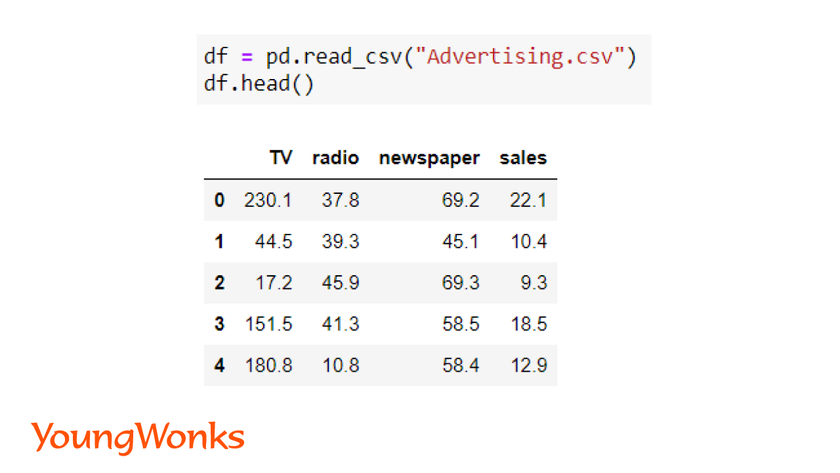
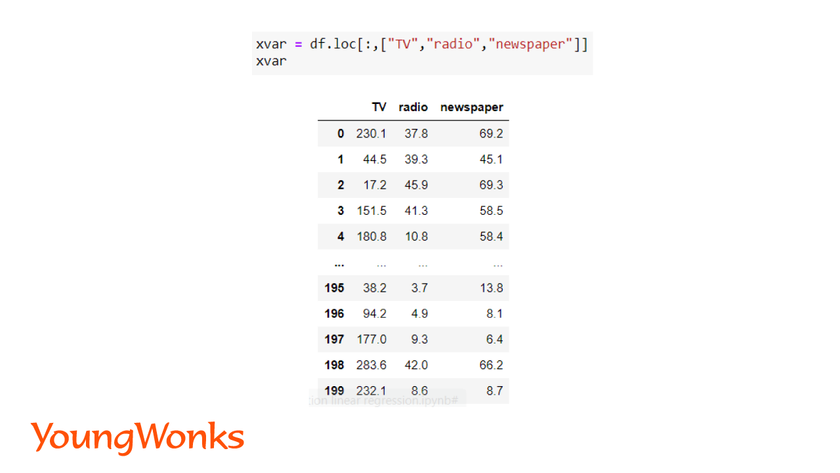
To understand this elaborately using a model, we have picked an advertisement dataset. It has the data of total sales, and the sales acquired through an advertisement in TV, newspaper and radio. Use the link given below to download the dataset:
https://www.kaggle.com/datasets/sazid28/advertising.csv
Step 1: Load and Preprocess Data
In multivariate linear regression, initial workflow remains the same where we load and pre-process the data.
Apart from using the pandas, matplotlib and numpy library, data scientists also use the seaborn library. This library provides advanced graphing technique which is useful in multiple linear regression. Using a single line of code, multiple graphs can be generated of each independent variable against dependent variable. It also ignores missing values during graph generation.
Syntax:
import seaborn as sns
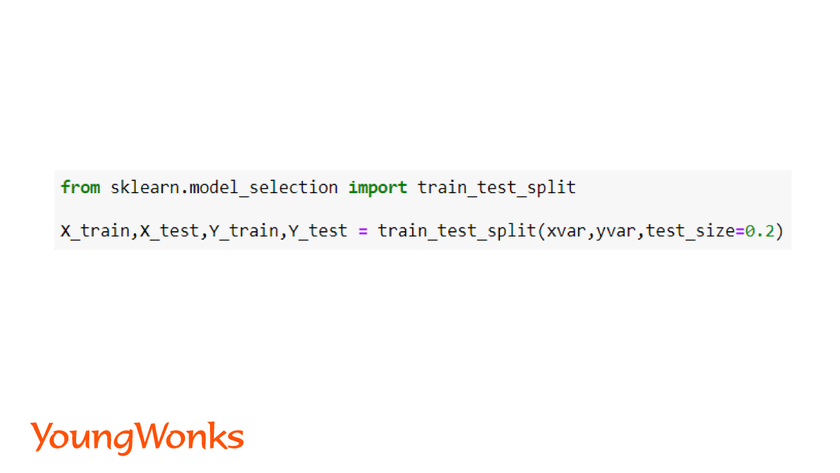
Step 2: Training and testing Data
Post pre-processing of data, we split the data into training data and testing data.
Train set is used to train the model and with the test set we evaluate the performance of the model.
Syntax:
from sklearn.model_selection import train_test_split
x_train, x_test, y_train, y_test = train_test_split(x, y, test_size=0.2)
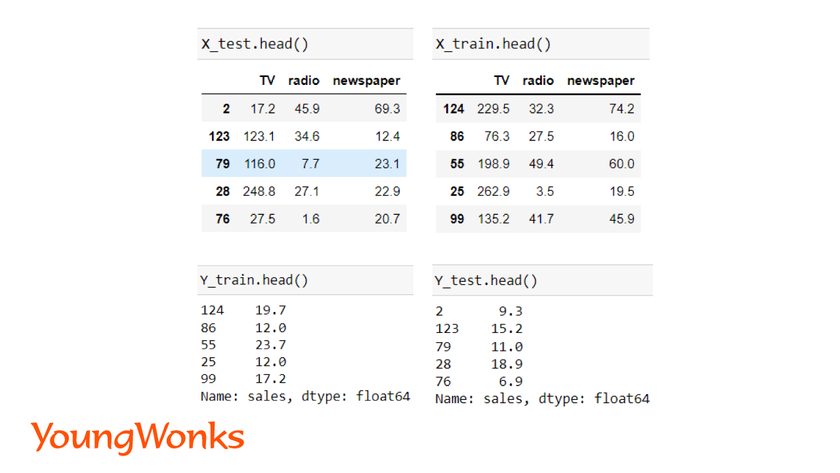
We can make use of the variables to display the columns of the dataset
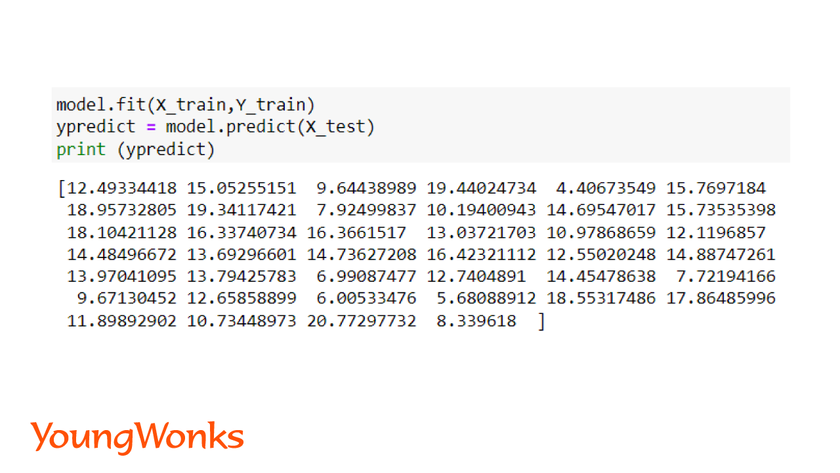
We create the linear regression model and fit the data.
Syntax:
from sklearn.linear_model import LinearRegression
model = LinearRegression()
model = model.fit(x_train, y_train)
ypredict = model.predict(x_test)
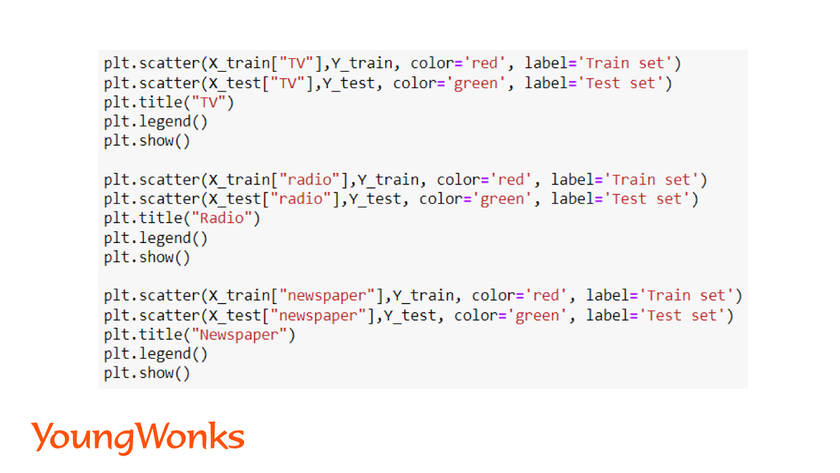
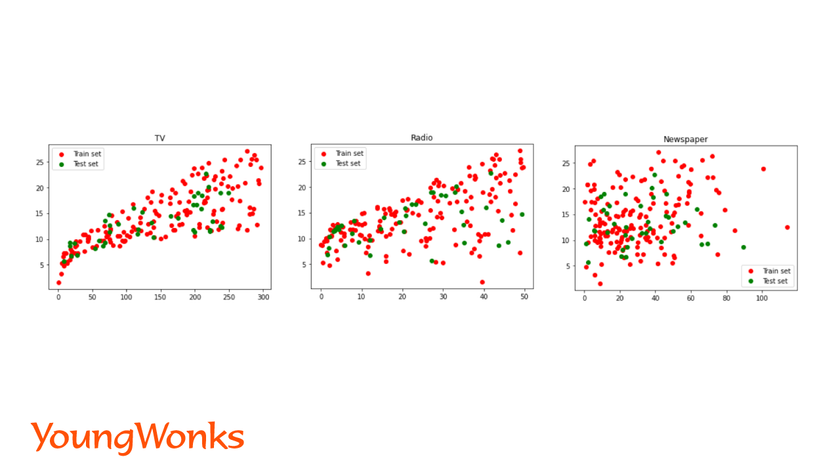
We can also view the data points of each independent variable with the dependent variable using a scatter plot
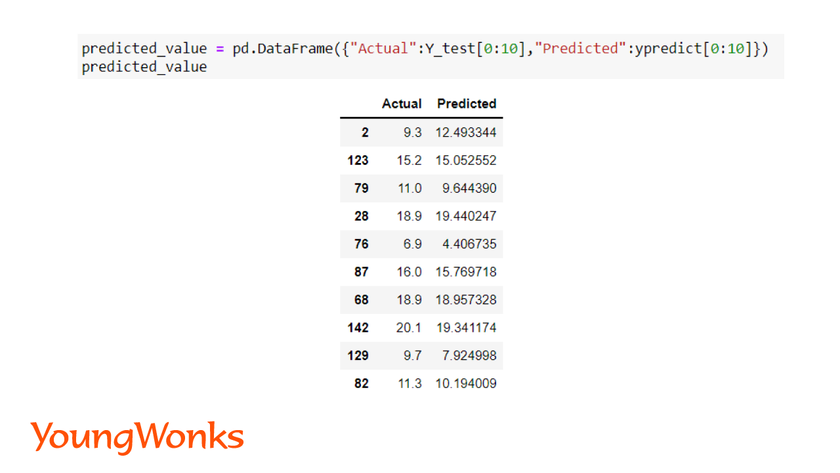
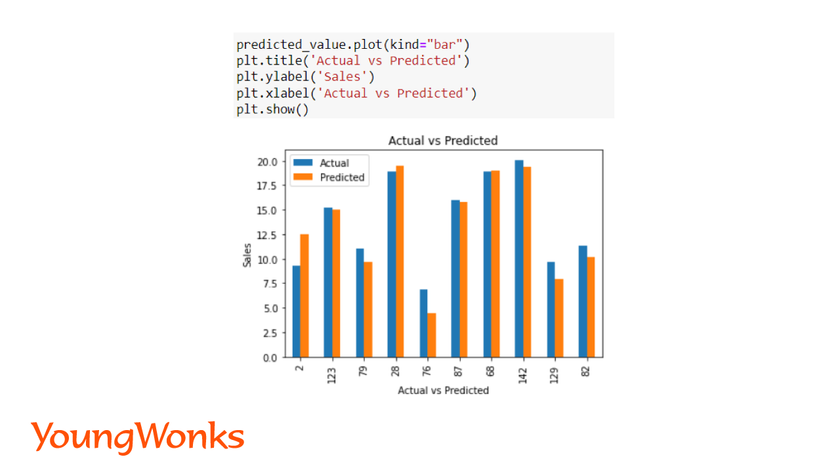
We can show the actual and predicted values using a bar plot predicted_value.
Let us first create a table to display the actual and predicted value, followed by a graph.
Syntax:
plot(kind="bar")
plt.show()
Let us now determine the coefficients of the model. We need to evaluate the model as well using the concept discussed in simple linear regression.
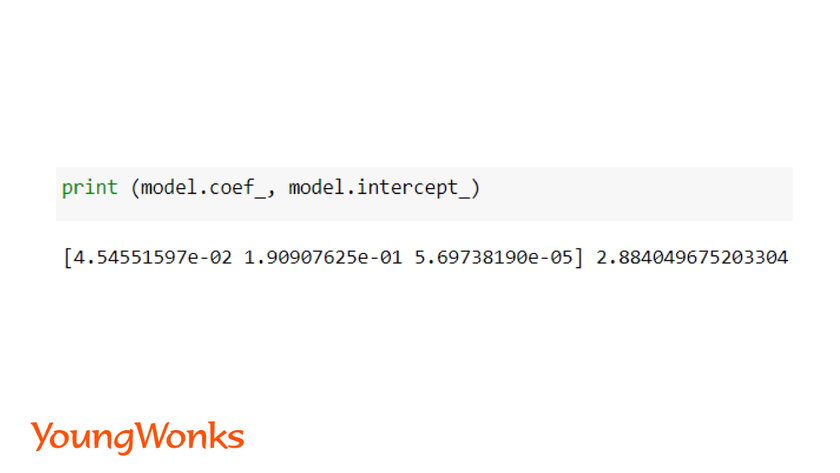
The purpose of creating these models is decision making. Now that we have this model, we can decide the next sales cycle. The 3 coefficients of the model for x1, x2 and x3 will help us determine the same. The largest coefficient is the largest multiplier and has biggest impact on the result. Hence, we can divide our fund allocated for advertisement in different medium appropriately to get maximum sales.
Conclusion
In this blog, we have covered the steps required to build a linear regression model. This model is easy to create and the workflow remains the same. Now you can try this out with other datasets available on kaggle, datahub or earth data. Logistic Regression is another important regression algorithm that determines discrete output. Logistic regression model is used for classification problems such as if a person has higher chance of having a disease or not, if an email is a spam email or not and text classification We will discuss logistic regression model in our next blog.
Further Learning Opportunities
If you're interested in deepening your understanding of sklearn and linear regression, consider enrolling in specialized Coding Classes for Kids offered by YoungWonks. These classes not only cover the basics of programming but also introduce young learners to more complex topics under the guidance of experienced instructors. For those specifically interested in Python, YoungWonks provides Python Coding Classes for Kids, which is a great way to get started with Python programming and its application in data science. Furthermore, YoungWonks offers AI Classes for Kids, designed to ignite curiosity and deepen understanding of artificial intelligence and machine learning among young minds. These classes are tailored to equip students with skills needed for the future.
*Contributors: Written by Aayushi Jayaswal; Lead image by Shivendra Singh